Singapore overall
2025 baseline*52.1%
What-if rate56.7%
+4.6 percentage points

RECYCLE RIGHT · SINGAPORE
Sort everyday waste, explore Singapore’s recycling potential and find the right route for your materials.
Play the sorting challengeOverall recycling rate
Every clean, separated stream is a better starting point.01 / A SMALL SORT. A BIG DIFFERENCE.
Ten everyday items. Three destinations.
From bubble tea to dabao. Drag each item to the right place.
Drag the top item onto the right bin. +10 points first try; +5 after a hint.
 CLEAN & DRY
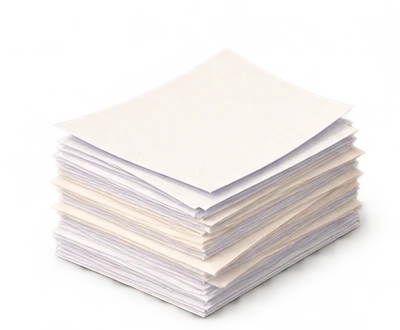
Used paper with no confidential information.
Drag me onto a destination+10 points for a first-try answer. +5 after a hint. Take your time.
Press and drag the top item onto a destination, then release. You can also activate the destination buttons with the keyboard. With the card focused, use ← Recycling, → Return Right, ↓ General waste. The next item appears automatically after a correct sort. There is no time limit for choosing a bin.
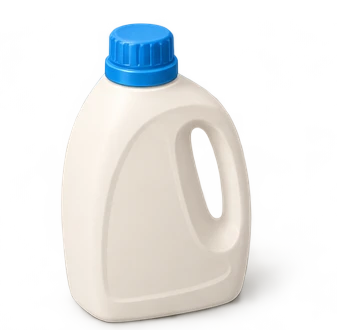
Empty and rinse plastic cups, takeaway containers, beverage cartons and glass bottles before recycling. Remove straws and food residue. Styrofoam packaging and disposable plastic cutlery go to general waste.
In this game, food waste goes to general waste where no separate food-waste collection is available. Return Right items are empty, uncrushed, 150 ml–3 L beverage containers bearing the BCRS Deposit Mark and a readable barcode.
Recycle Right guidance ↗ · Return Right eligibility & locations ↗
YOUR SMALL HABIT, MULTIPLIED
All 6.21 million people. A little more, every week.
Extra recycling split equally between paper & plastics.
+4.6 percentage points
+13.5 percentage points
+18.1 percentage points
Additional annual recycling: 161,460 tonnes of paper/cardboard + 161,460 tonnes of plastics.
Assumes the extra recycling comes from paper/cardboard and plastics that would otherwise be disposed of, split 50/50 by weight. Total waste generated stays fixed; other waste streams stay unchanged.
For each stream: (2025 recycled tonnes + extra annual tonnes) ÷ 2025 generated tonnes × 100. The national rate adds both streams to the national recycled total.
*Baselines are calculated from NEA’s rounded 2025 tonnages: overall 3,657,000 recycled / 7,015,000 generated; paper/cardboard 369,000 / 1,192,000; plastics 34,000 / 890,000. NEA publishes these as 52%, 31% and 4%; this model displays one decimal place. Rates and percentage-point changes are rounded separately. It combines 2025 waste totals with June 2026 population for illustration.
Source: NEA 2025 waste statistics ↗An illustrative “what if”, separate from your game score. Uses the rounded population and 52 weeks; assumes the additional weight is accepted and recycled. These are potential additional tonnes, not measured collections or carbon savings. Population source: SingStat ↗
Illustrative scenario · 2025 baseline → what-if rate
02 / START WITH WHAT YOU HAVE
Choose a material for practical guidance.
A CLEANER PAPER STREAM
Keep paper and cardboard dry, separate from food and ready for collection.
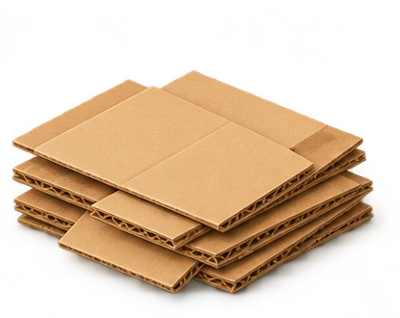
Office paper, corrugated cartons and packaging offcuts.
Flatten cartons where practical. Keep materials under cover and away from food waste.
Confidential documents? Use secure shredding rather than ordinary paper collection.
Check BCRS eligibility & find a Return Right machine ↗See the next chapter of your paper, plastic and wood. Scan your digital weighbridge ticket to explore your contribution on our Green Map.
Explore the Green Map →